The following Standard Market Snapshots are available for publication to your Web site, Facebook and other social media. They summarize the market conditions in a selected neighborhood over the last three months, for a specific property type.
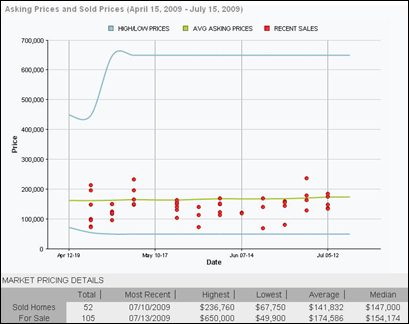
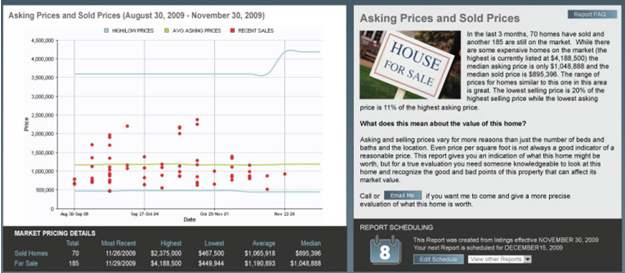
Charts the price trends—whether prices are rising or falling by comparing high, low and median values for list price and sold price.
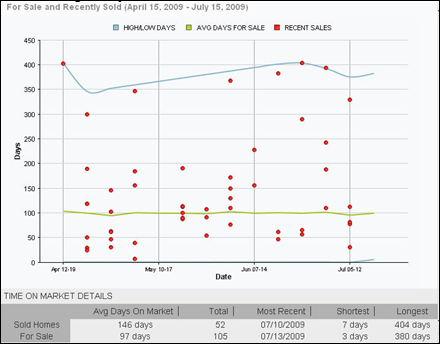
Indicates how long it may take a prospective seller to sell their home.
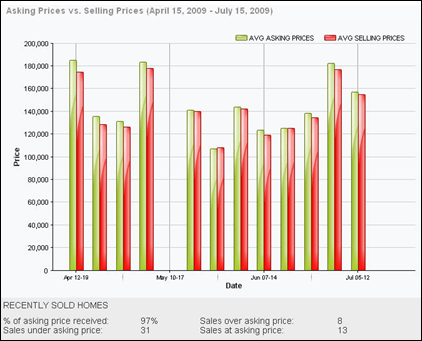
Compares asking price to the actual selling price to determine how close the asking price is to current market value.
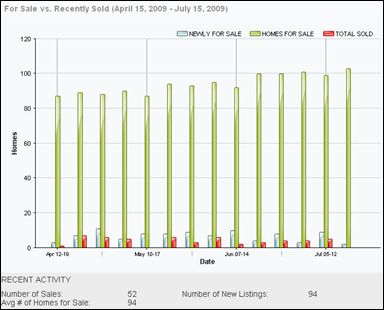
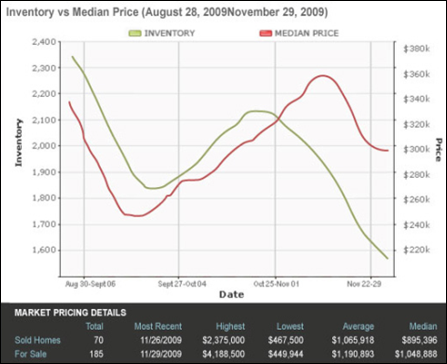
The number of homes on market indicates if the market is growing or shrinking, making it a Buyer’s, Seller’s or a neutral market.
The four Standard Market Snapshot displays described above are available
for use with Market Snapshot Pro, where they are accompanied by some explanatory
text. Example![]()
The following two additional graphs are available with Market Snapshot Pro.
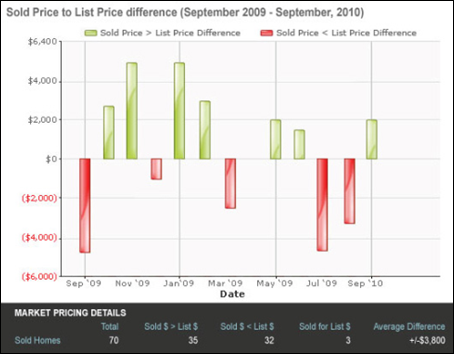
Illustrates the average dollar amount difference between listing and sold prices for properties sold in the time period you requested. The bars show selling amounts above and below the listing price (the $0 mark).
The table beneath the graph gives the breakdown of what sold above, at, and below listing price.
Graph is created for the time period you requested, and show the median list price of the selected listings, and the number of active listings.
The table beneath the graph is an Asking and Sold price comparison.